
An interactive, single-page visualizer covering three Algorithms II topics, built for a university midterm with step-by-step animation and pseudocode highlighting.
For an Algorithms II midterm, I kept noticing that algorithms like matrix chain multiplication are easy enough to code but hard to actually build real intuition for just by reading the code. You can trace through a DP table on paper once and still not really feel why it works.
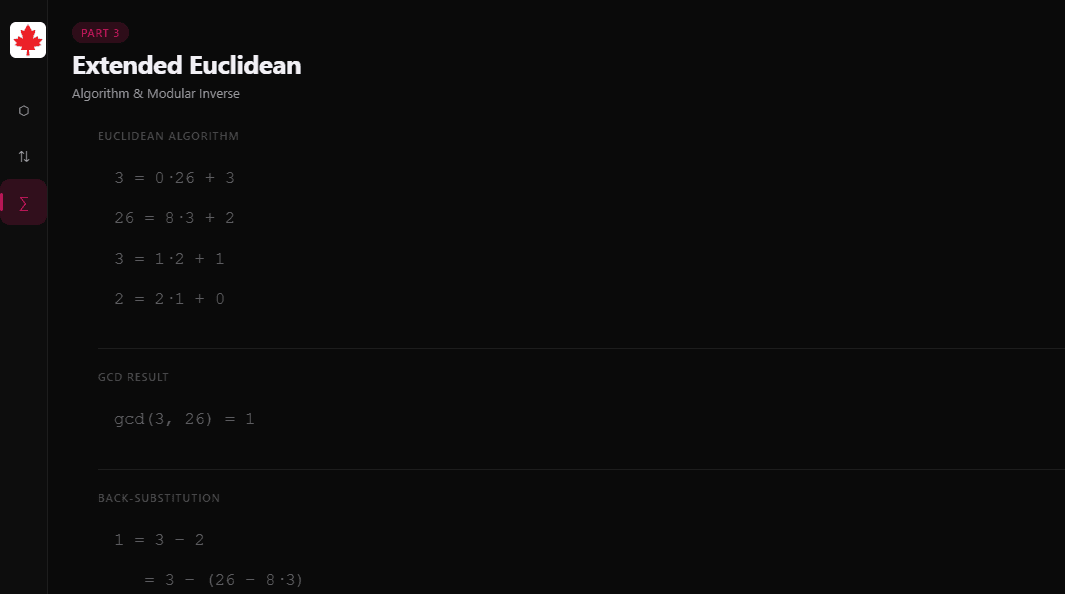
Pick an algorithm, Matrix Chain DP, Parallel Merge Sort, or Extended Euclidean, and step through it one move at a time.
Every animation frame syncs to the exact pseudocode line driving it.
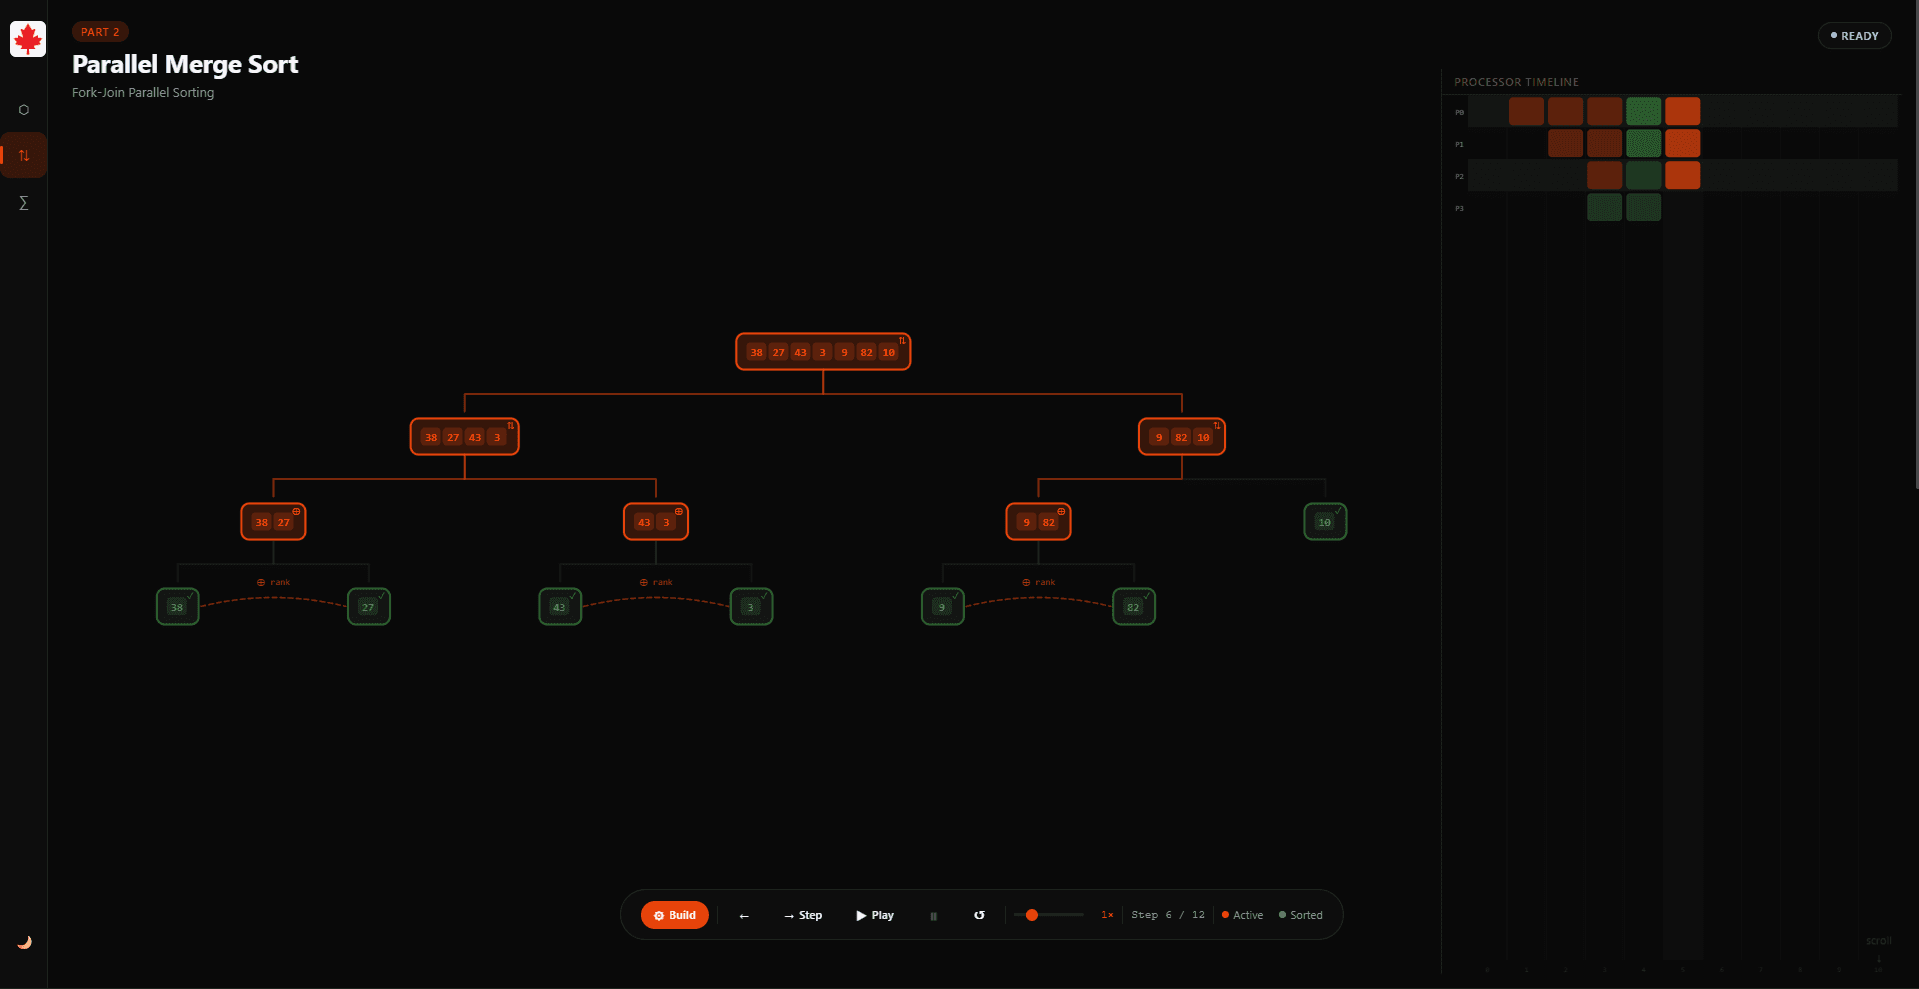
A live Brent's theorem bound tracks the parallel merge sort's theoretical vs. actual speedup as it runs.
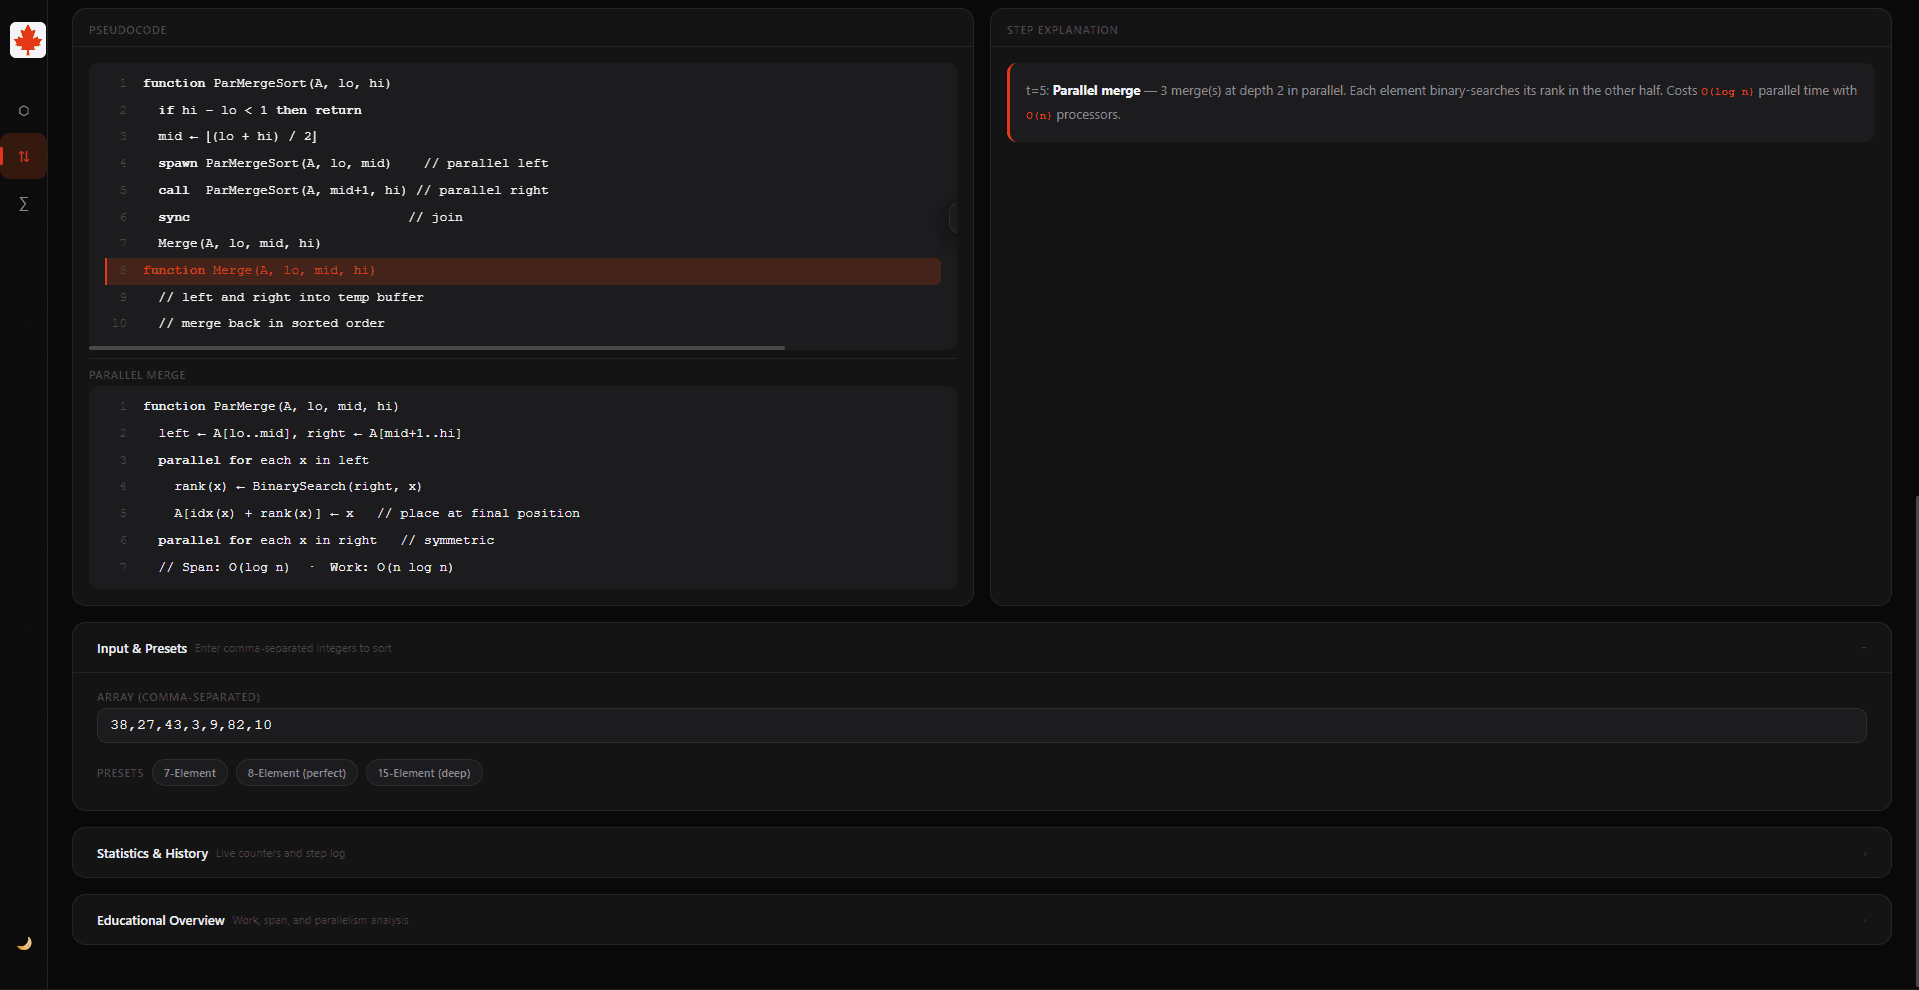
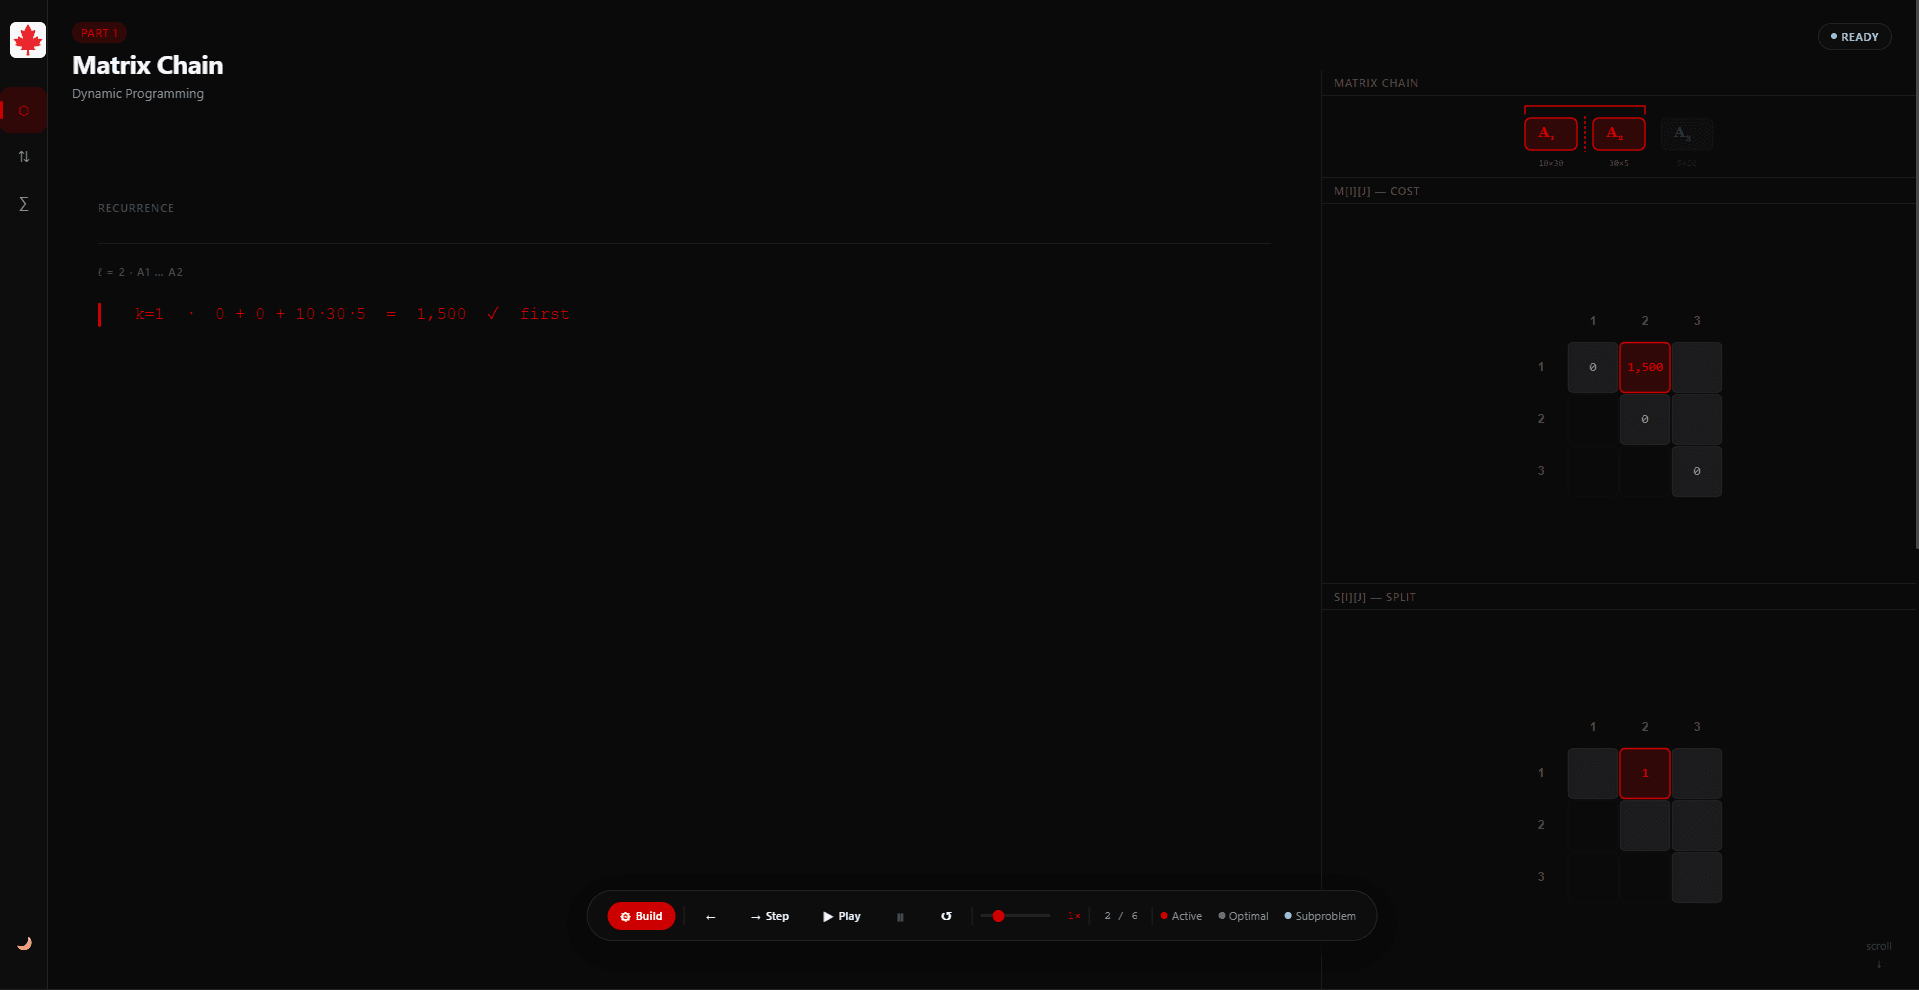
Matrix Chain Multiplication: the DP cost and split tables filling in cell by cell.
Algorithms Visualized
Build Dependencies
Native Rendering
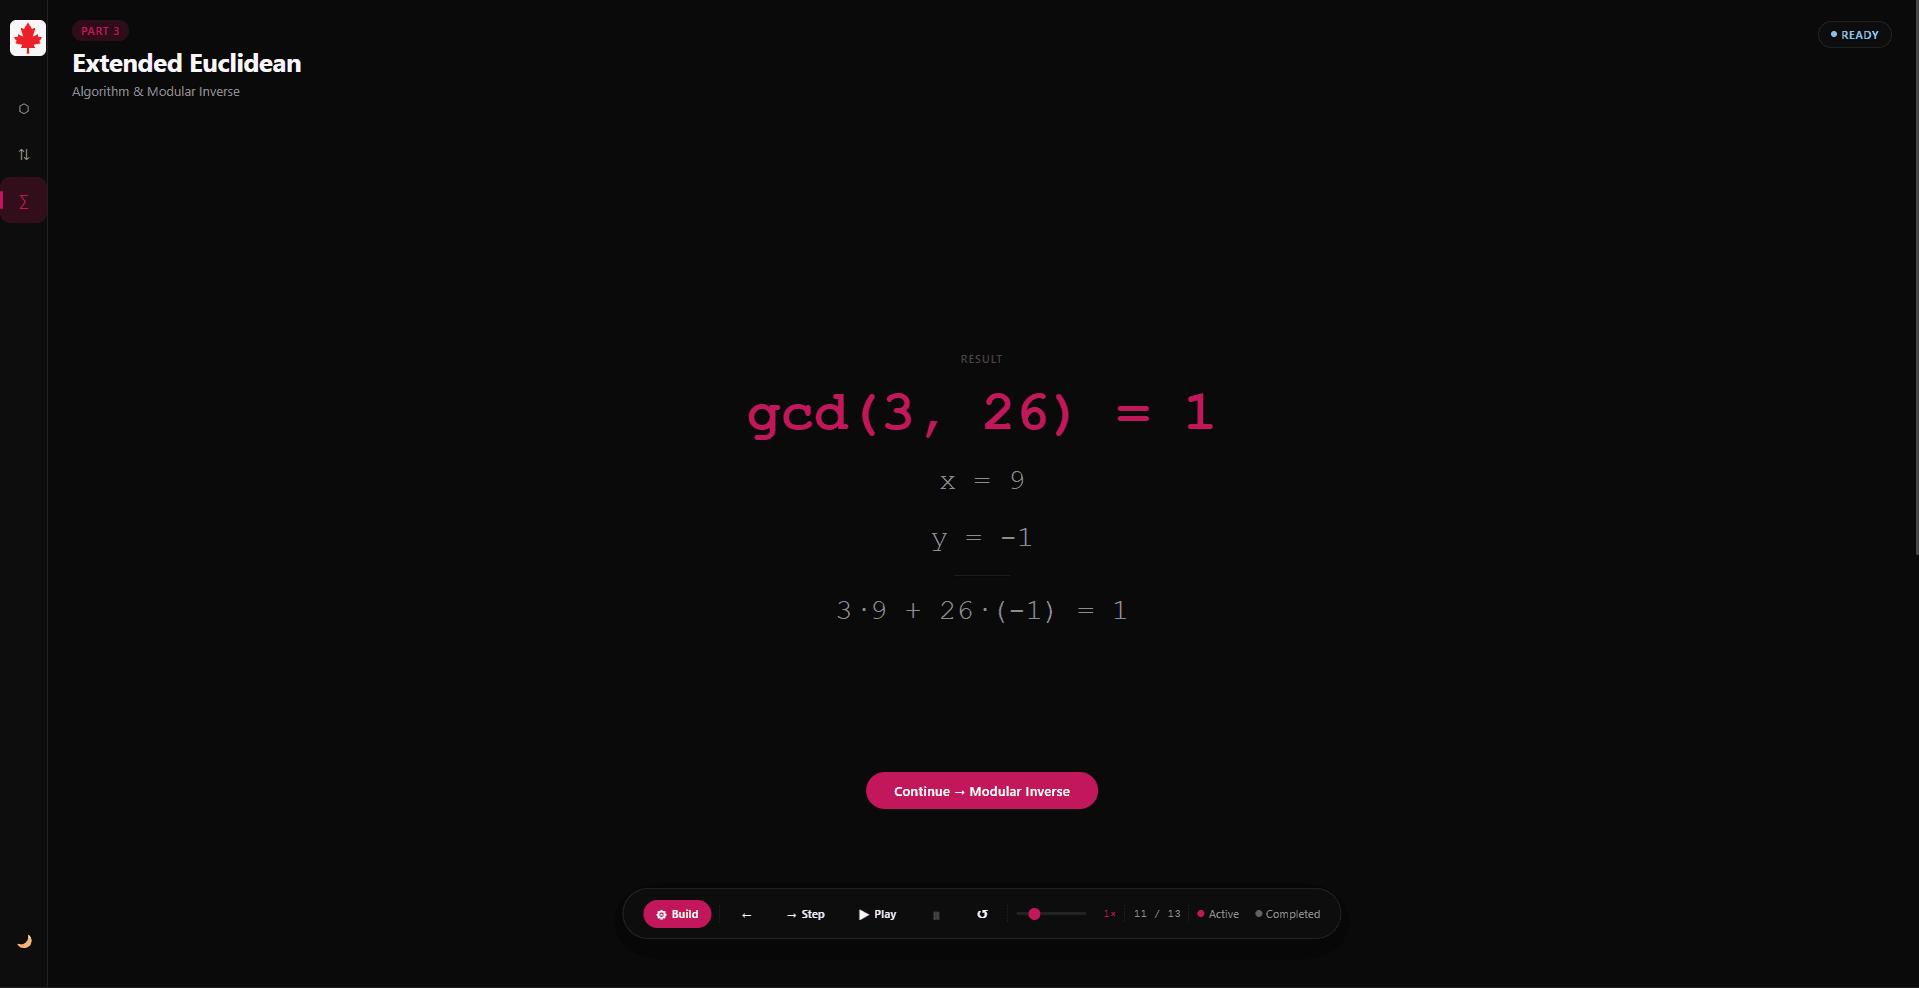
Built three fully animated visualizations (Matrix Chain Multiplication using dynamic programming, Parallel Merge Sort using a fork-join model, and the Extended Euclidean Algorithm), each with step-by-step playback and pseudocode highlighting.
Rendered every visualization natively in SVG, including DP cost/split tables, recursion trees, and a Gantt chart of processor utilization, with no canvas API or external charting library.
Computed a live Brent's theorem bound (T_p ≤ W/p + D) alongside the Gantt chart to show the parallel merge sort's theoretical vs. visualized speedup.
Shipped as a single self-contained HTML file with no build step or dependencies, with dark/light theming persisted via localStorage.